Create and Manage Grafana Alerts
Given the robust structure and components of Nebari, monitoring the health and performance of your deployment is crucial. Nebari integrates Grafana for monitoring and visualization of metrics, commonly used for its dashboard capabilities. Grafana also provides a powerful alerting system that allows you to create, manage, and receive notifications based on specific conditions in your data.
In this guide we will walk you through the steps to create and manage alerts in Grafana, while providing a quick example of setting up an alert to monitor CPU usage on your Nebari deployment.
Accessing Grafana
To access Grafana and start creating or managing Alerts, you need to first make sure you have the necessary permissions within Keycloak to access the admin features of Grafana. Check out Keycloak roles and permissions for more information.
Once you have the necessary permissions, you can access Grafana by navigating to
http://<your-nebari-domain>/monitoring in your web browser:
If your permissions are correct, you should see the "Administration" section in the left sidebar. ::
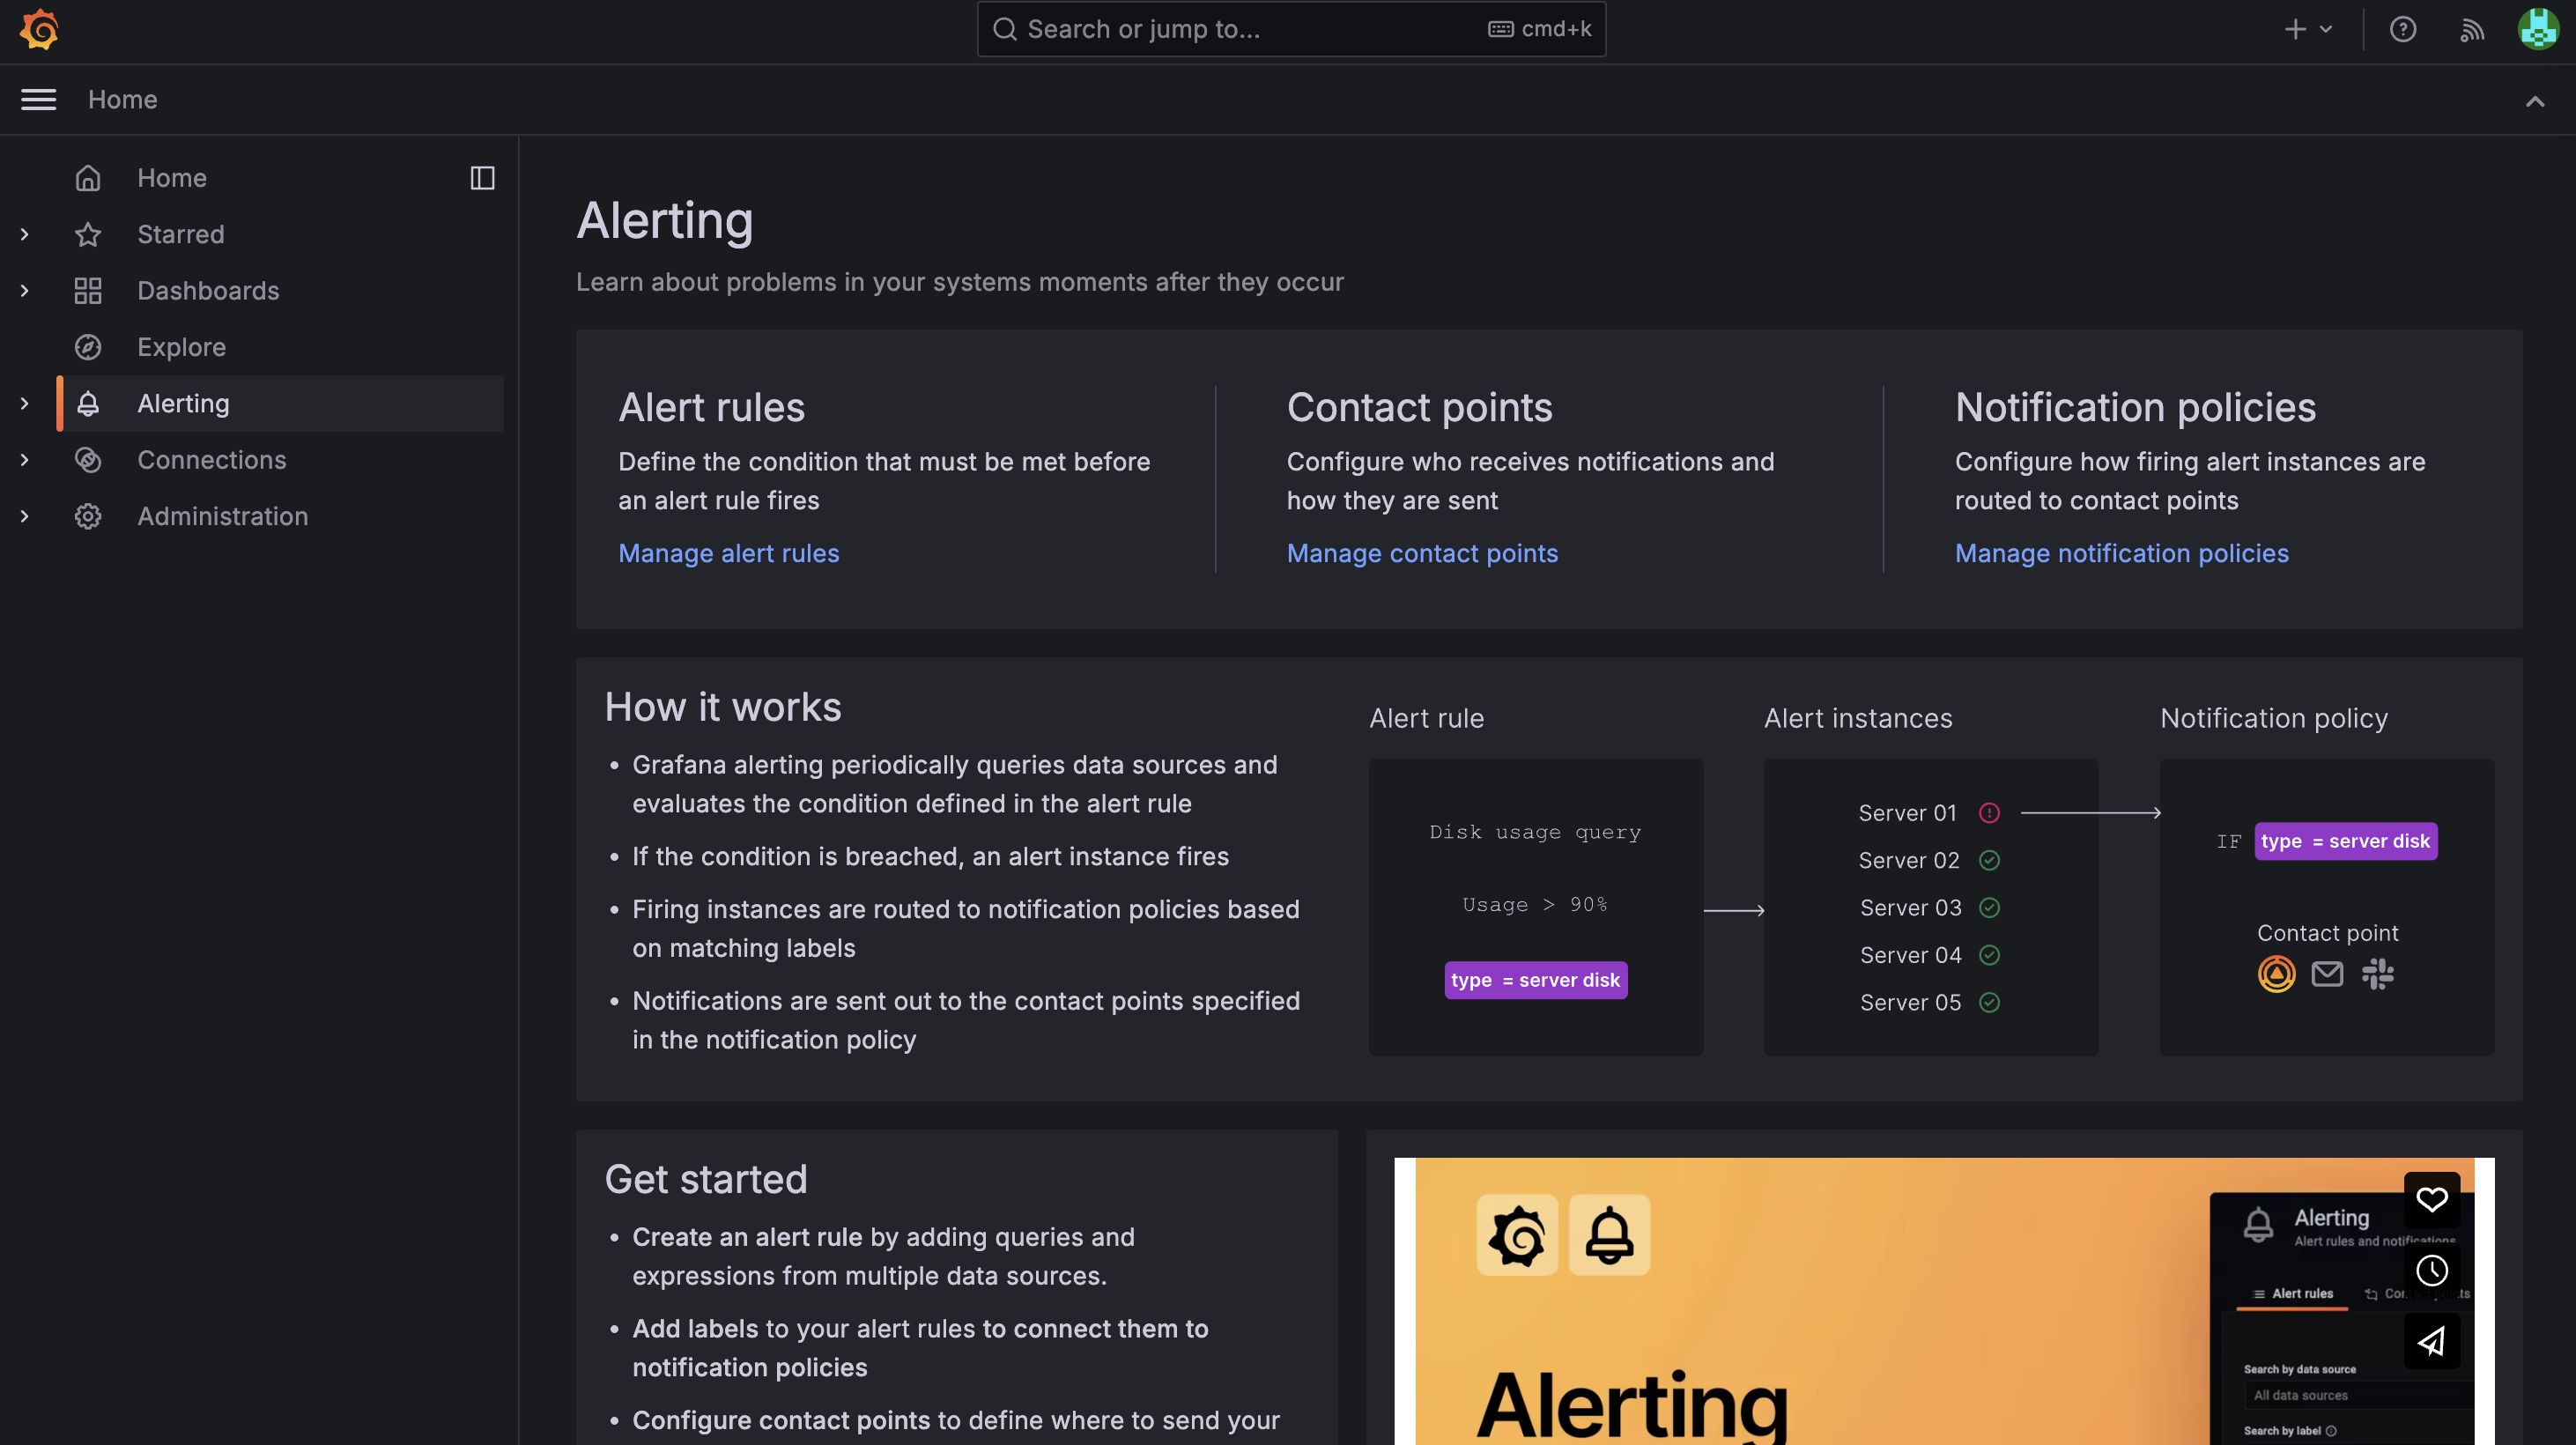
Once logged in, you can navigate to the Alerting section to create and manage your alerts.
Creating Alerts
Nebari comes with a set of pre-configured alert rules that monitor various aspects of the cluster, which are deployed as part of the Grafana Helm chart installation stack. You can view and manage these existing alerts, or create new ones tailored to your specific monitoring needs.
Steps to Create a New Alert Rule
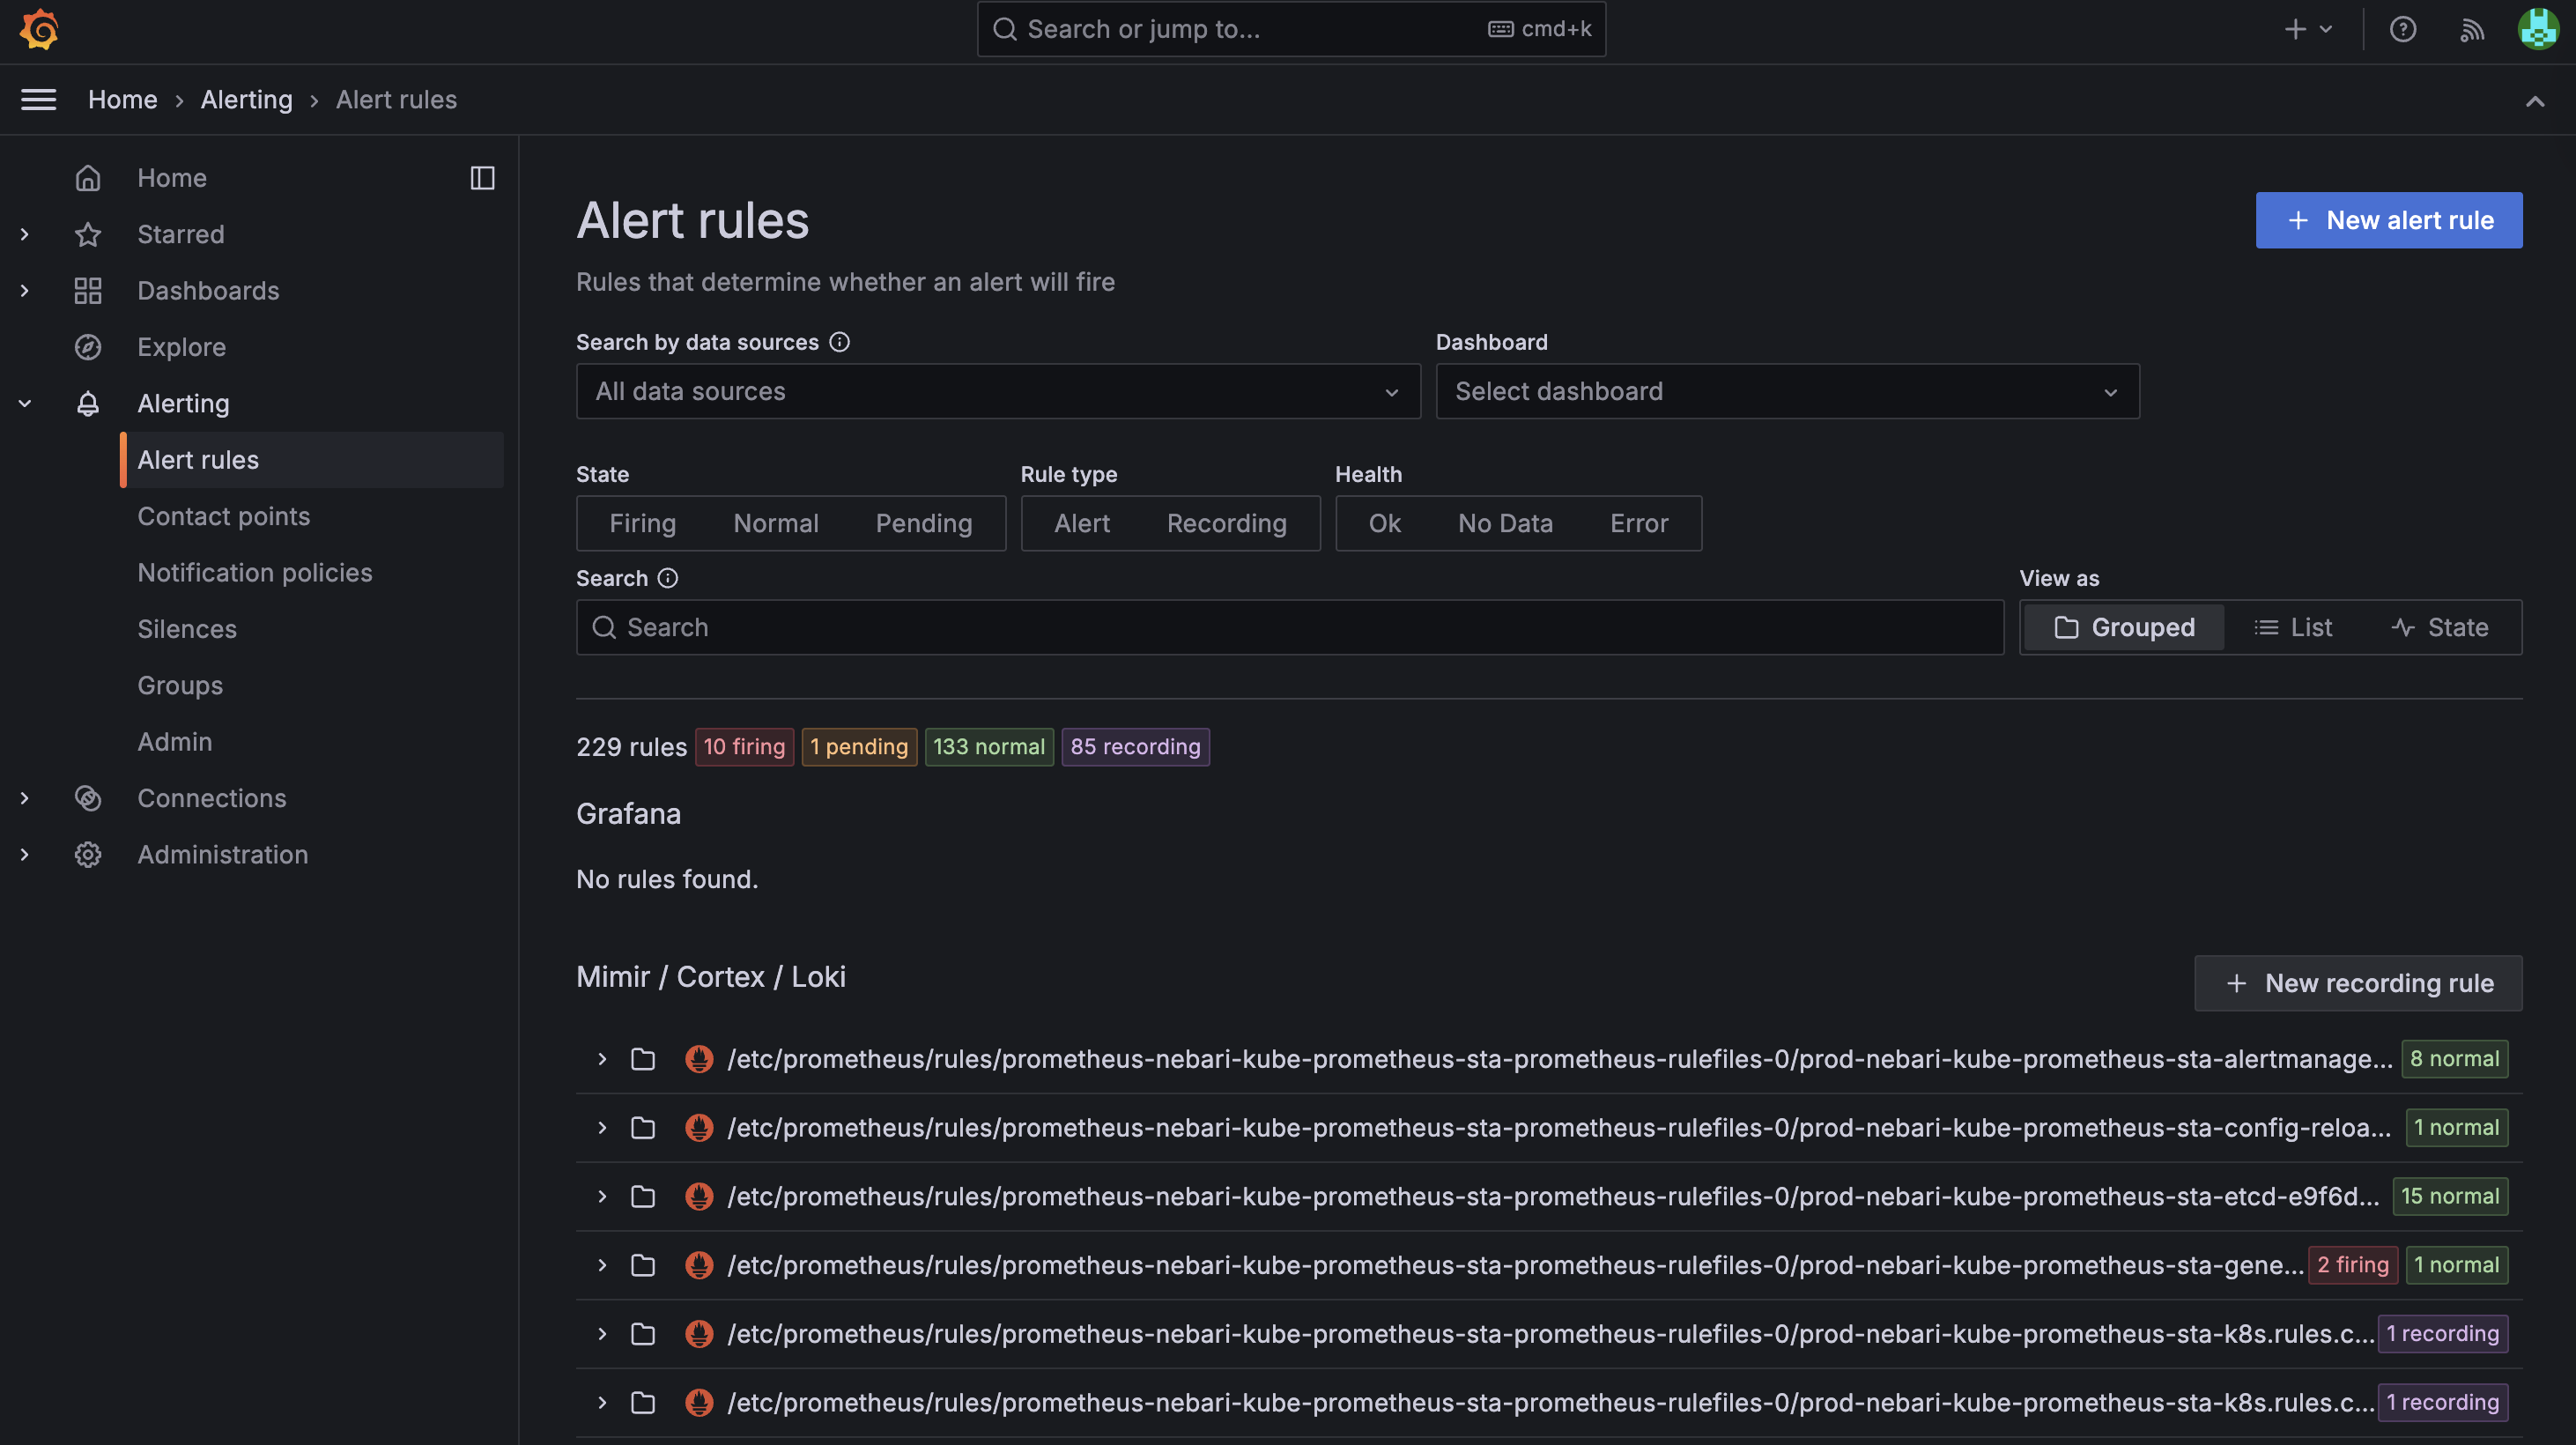
- Navigate to Alerting → Alert Rules in the left sidebar.
- Click on New alert rule.
- Fill in the alert rule details:
- Name: Choose a descriptive name (e.g.,
High CPU Usage). - Query: Select your data source (typically Prometheus in Nebari) and build a query.
Example:
This calculates average CPU usage over 5 minutes.
avg(rate(container_cpu_usage_seconds_total{namespace="default"}[5m])) * 100 - Condition: Define the threshold (e.g.,
> 80%). - Evaluation interval: Set how often the rule should be evaluated (e.g., every 1m).
- For: Specify how long the condition must be true before firing (e.g., 5m).
- Labels/Annotations: Add metadata such as severity (
warning,critical) and description.
- Name: Choose a descriptive name (e.g.,
- Under Notifications, attach the rule to a contact point.
- Contact points can be email, Slack, PagerDuty, etc. (configured in the "Contact points" tab).
- Save the alert rule.
Example: Network Performance Alert
Here's a practical example of creating a network-related alert that monitors network connectivity and performance, similar to what enterprise network monitoring tools like WhatsUp Gold would track:
Alert: High Network Error Rate
This alert monitors for excessive network errors which could indicate connectivity issues, hardware problems, or network congestion.
Alert Configuration:
- Name:
High Network Error Rate - Query A (Network errors):
rate(node_network_receive_errs_total[5m]) + rate(node_network_transmit_errs_total[5m]) - Query B (Total packets):
rate(node_network_receive_packets_total[5m]) + rate(node_network_transmit_packets_total[5m]) - Expression (Error percentage):
(${A} / ${B}) * 100 - Condition:
IS ABOVE 1(Alert when error rate exceeds 1%) - Evaluation interval:
1m - For:
3m(Alert fires after condition persists for 3 minutes)
Labels:
severity: warning
component: network
team: infrastructure
Annotations:
summary: High network error rate detected on {{ $labels.instance }}
description: Network error rate is {{ $value }}% on interface {{ $labels.device }} of node {{ $labels.instance }}, which exceeds the 1% threshold.
Alert: Network Interface Down
This alert detects when network interfaces go offline, which is critical for maintaining connectivity.
Alert Configuration:
- Name:
Network Interface Down - Query:
up{job="node-exporter"} == 0 or node_network_up == 0 - Condition:
IS BELOW 1 - Evaluation interval:
30s - For:
1m
Labels:
severity: critical
component: network
team: infrastructure
Annotations:
summary: Network interface down on {{ $labels.instance }}
description: Network interface {{ $labels.device }} on node {{ $labels.instance }} is down or unreachable.
Alert: High Network Bandwidth Utilization
Monitor for high bandwidth usage that could impact application performance.
Alert Configuration:
- Name:
High Network Bandwidth Usage - Query:
(rate(node_network_receive_bytes_total[5m]) + rate(node_network_transmit_bytes_total[5m])) * 8 / 1e9 - Condition:
IS ABOVE 0.8(Alert when usage exceeds 800 Mbps on a 1Gbps link) - Evaluation interval:
1m - For:
5m
Labels:
severity: warning
component: network
team: infrastructure
Annotations:
summary: High bandwidth utilization on {{ $labels.instance }}
description: Network bandwidth usage is {{ $value }}Gbps on interface {{ $labels.device }} of node {{ $labels.instance }}, approaching capacity limits.
These network alerts provide comprehensive monitoring similar to enterprise tools and help ensure:
- Connectivity: Early detection of interface failures
- Performance: Monitoring for error rates and bandwidth saturation
- Reliability: Proactive alerting before network issues impact users
Managing Notifications and Policies
After creating rules, you need to configure how and when alerts are sent:
- Contact Points: Define where alerts should be delivered (e.g., team email, Slack channel).
- Notification Policies: Control routing, grouping, and silencing of alerts. This is particularly useful to:
- Prevent alert fatigue by grouping related alerts.
- Define escalation paths.
- Mute alerts during maintenance windows.
For example, you can create a notification policy that routes all critical alerts to Slack, and warning alerts to email.
Next Steps
- Regularly review and tune your alert thresholds to match real-world workloads.
- Use silences during maintenance windows to avoid noisy alerts.
- Explore alert dashboards to visualize trends in triggered alerts.
For more information on handling alerts in Grafana, check out the official Grafana documentation: Create Grafana managed rule